
Queue System
Turning a six-hour supplier wait into a bookable queue — research-led, from a messy operational situation to a system the factory's own IT team shipped.
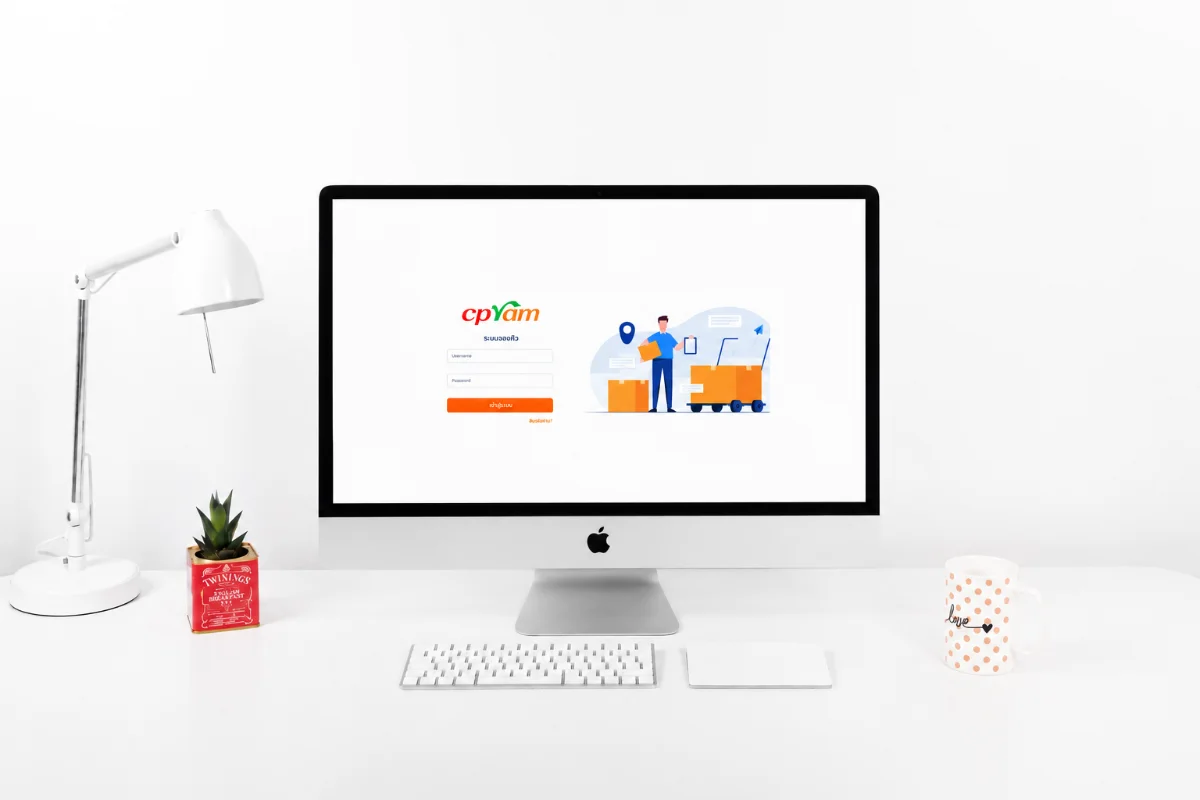
Overview
CPRAM Co., Ltd. is CP Group's food manufacturer — a factory that takes in around 300 raw-material and packaging deliveries a day. I joined its CPRAM Event programme as the UX Researcher on a cross-functional team drawn from Warehouse, Planning, QA, IT and R&D, working on a PDCA plan over seven months.
There was no brief and no feature request. What we had was a situation: trucks queueing along the public road outside the plant, and a growing pile of complaints from the delivery firms who had to sit in them. My job was to find out what was actually going wrong, prove which problem was worth solving, and design something the in-house IT team could build.
What we shipped was an online queue-booking system. Suppliers pick the POs they're delivering, book a time slot against real loading-dock capacity, receive a QR code, check in at the security gate, and get notified when the queue shifts. Warehouse sees the day's incoming schedule in advance; Planning finally gets stock visibility.
The starting point
First come, first served — and nobody could see anything.
Deliveries ran at roughly 300 trips a day — 7,894 in a single month in 2021 — and every one of them arrived unannounced. There was no booking, no schedule and no visibility: whoever reached the gate first got unloaded first, so suppliers came early and waited. On average a delivery took 360 minutes — six hours; some gate logs showed four to eight.
The cost of that wait didn't sit with the factory. Supplier satisfaction scores for the warehouse (82.14 in 2019, 83.16 in 2020) had been below the internal target for two years running, and the complaints had turned into behaviour: delivery firms were refusing factory jobs, and drivers were quitting.
Three candidate problems
Interviews across eight roles, each problem priced.
I interviewed across eight roles — Management, Purchasing, Sales, IT, Planning, Warehouse, QA and the drivers themselves. The queue was the loudest complaint, but it wasn't the only one, and I didn't want the team to pick the loudest thing. So I wrote up all three problems people raised and put a number on each, using the factory's own operational records.
Choosing the problem
A five-criteria score, not a show of hands.
In a cross-functional team, whoever argues hardest usually wins. To avoid that, we scored all three problems on five criteria — importance, urgency, cost value, number of departments involved, and time to fix — and multiplied the scores so a weakness on any one axis really counted.
The waiting-time problem came out on top at 81. It was measurable in money, it touched the most departments, and it was fixable inside the programme window — the redundant price-comparison process was cheap to fix but low-value, and the urgent-PO problem was expensive but depended on overseas lead times we couldn't influence.
Scoring did something a discussion wouldn't have: it gave the people whose problem wasn't chosen a reason they could accept, which is why we still had their cooperation when it came time to research the journey.
Research — walking the wait
Observation, root-cause analysis, twelve interviews.
The 360-minute figure came from records, so I went and walked it: gate, QA, warehouse, stopwatch in hand, timing each stage of a real delivery. It held up — and standing in it told me something the number didn't. Most of the six hours is dead time in a truck cab, not work.
I ran a fishbone analysis with the team across Man, Method, Environment, Material and Machine. Three root causes survived it: suppliers arrive unscheduled and therefore simultaneously, there are not enough loading docks to absorb the peak, and there is no queue discipline once they're on site. Only the first is a design problem — which is exactly why a booking system, not more docks, was the answer we could afford.
Then twelve field interviews: purchasing and warehouse staff, production, QA, security, supplier sales managers and drivers. Same event, five different kinds of pain — and two of them became the people we designed for.
The same six hours, felt from every side of the gate. Quotes as spoken, in Thai, with translations.
“กว่าจะได้กลับบ้านก็ตี 3–4 พนักงานมีปัญหาสุขภาพ เวลาพักน้อย และลามไปถึงปัญหาครอบครัว เพราะไม่ได้เจอภรรยาที่บ้านเลย”
“Drivers don’t get home until 3 or 4 a.m. — health problems, barely any rest, and it reaches their families: some never see their wives at home at all.”
“Sup. โทรหากลางดึก เนื่องจากยังไม่ได้ลงสินค้า”
“Suppliers call me in the middle of the night because they still haven’t unloaded.”
“ต้องทำงานเกินเวลาเพราะ Sup. ยังลงสินค้าไม่หมด”
“We’re on overtime because suppliers still haven’t finished unloading.”
“ไม่สามารถเช็คสต็อก real-time ได้ ทำให้ทำงานล่าช้า”
“I can’t check stock in real time, so my work runs late.”
“รถโฟล์คลิฟท์ที่ขนสินค้าไปลงที่โรงงานต้องไปช่วยที่คลัง ทำให้แผนผลิตล่าช้า”
“Forklifts get pulled over to help the warehouse, so the production plan slips.”
“คิวรอตรวจคุณภาพสินค้าไม่เป็นระเบียบ ทำให้เกิดความล่าช้า”
“The QA inspection queue has no order, and everything runs late.”
“มีคนรถมาโวยวายหน้าป้อม รปภ. แจ้งว่าโดนแซงคิว”
“Drivers come shouting at the security post that someone cut the queue.”
“ได้รับคำร้องเรียนจากคนรถตลอดเวลา พนักงานลาออกประจำ บริษัทขนส่งไม่อยากรับงาน”
“I get complaints from the drivers all the time — people keep resigning, and delivery firms don’t want the job.”
“อยากมีเวลาให้ครอบครัวมากขึ้น”
“I just want more time with my family.”
“บริษัทเสียค่าใช้จ่ายในการรอคอย”
“The waiting is costing our company money.”
“ต้องรีบมารับคิวตั้งแต่เช้า บางครั้งโดนแซงคิว”
“I have to rush in at dawn to grab a queue — and sometimes I still get cut.”
“พนักงานขนส่งทยอยลาออก เพราะทำงานหนักเกินเวลา”
“My drivers keep resigning — the hours are just too hard.”
“ค่าใช้จ่ายในการทำงานนอกเวลารวมค่าเช่ารถส่งสินค้าเฉลี่ย 4,000 บาท/เดือน”
“Overtime plus truck rental averages 4,000 THB a month.”
“รอลงของ 4 ชม. หาก 8 ชม. ยังไม่ได้ลงของ จะเอารถกลับ ไม่ส่งของ”
“We’ve waited four hours. If it hits eight and we still haven’t unloaded, we’re taking the truck back — no delivery.”
Mapped end to end, a delivery day runs about seven hours, and the emotional low sits squarely in the four-to-six-hour wait — not at the gate, not at unloading. That's where the opportunities were.
Design
Flow first, sketches second, Figma last.
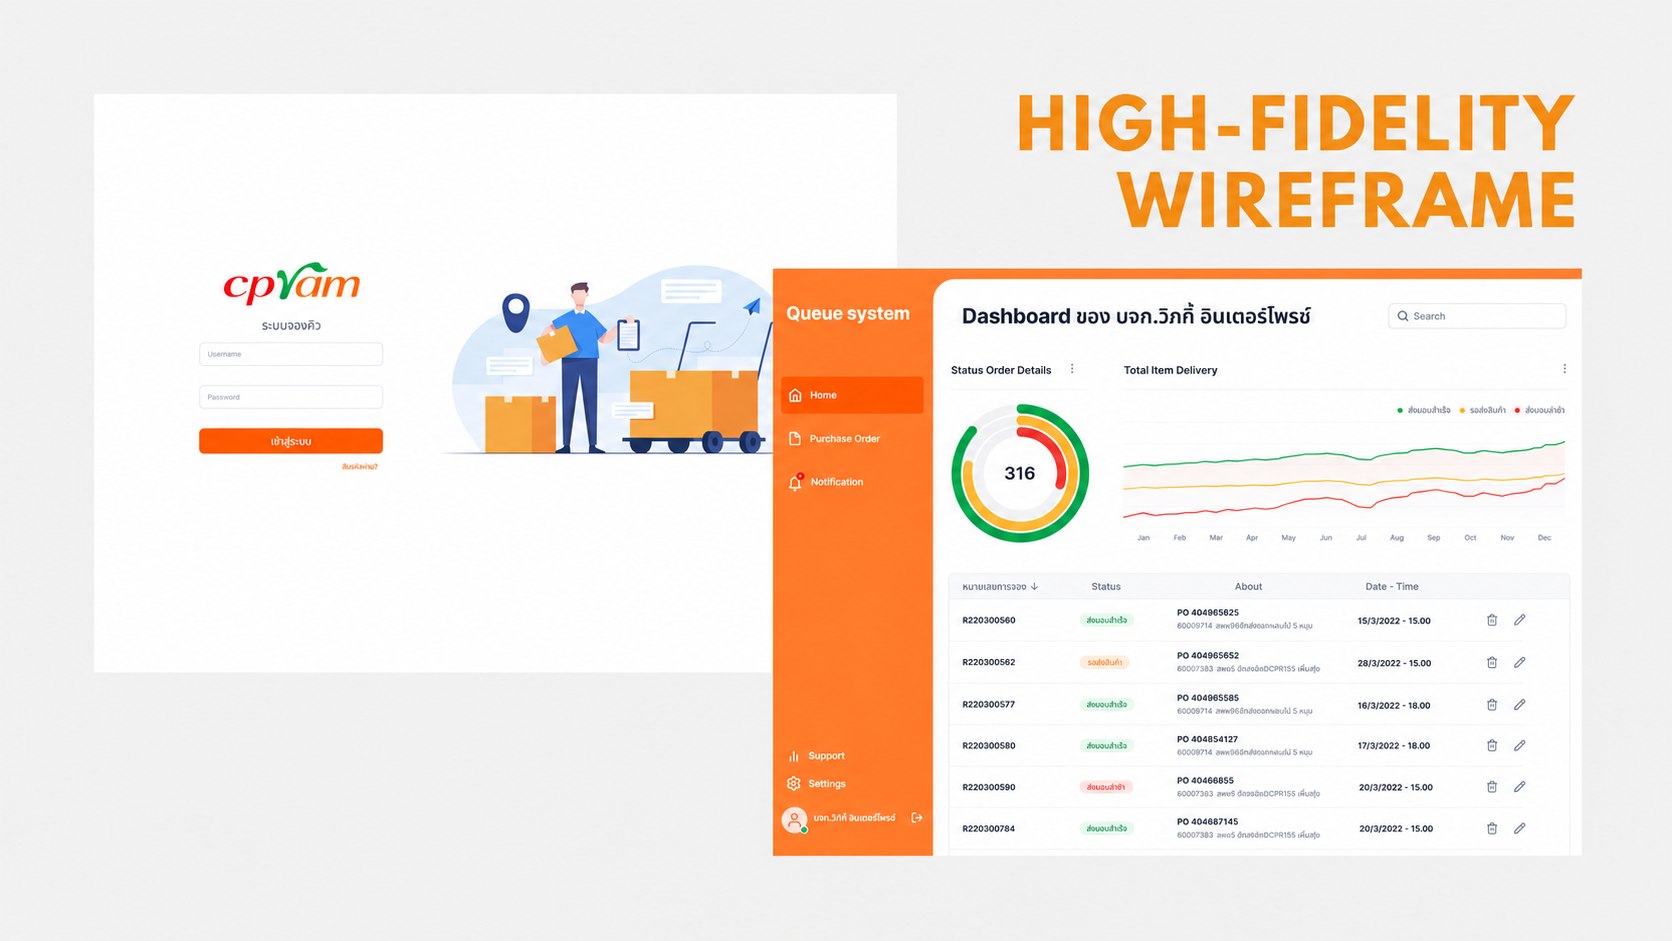
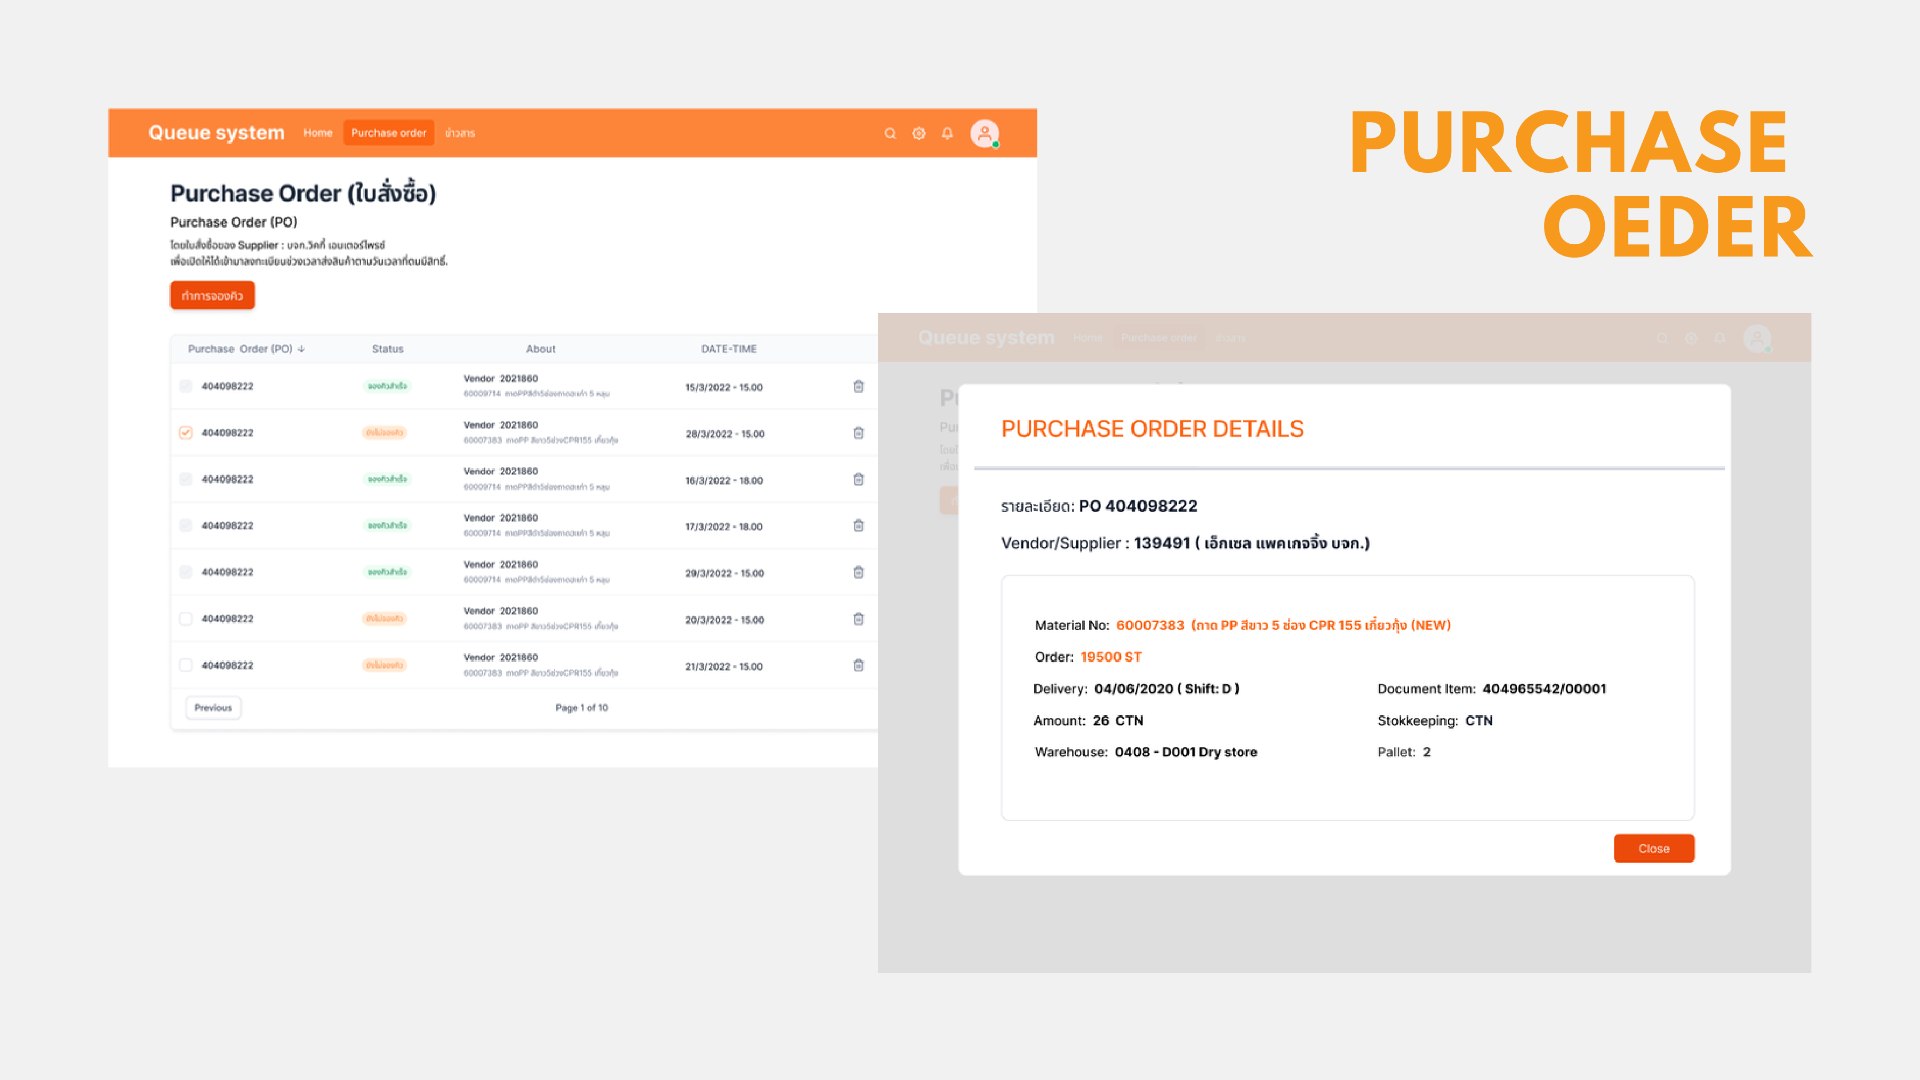
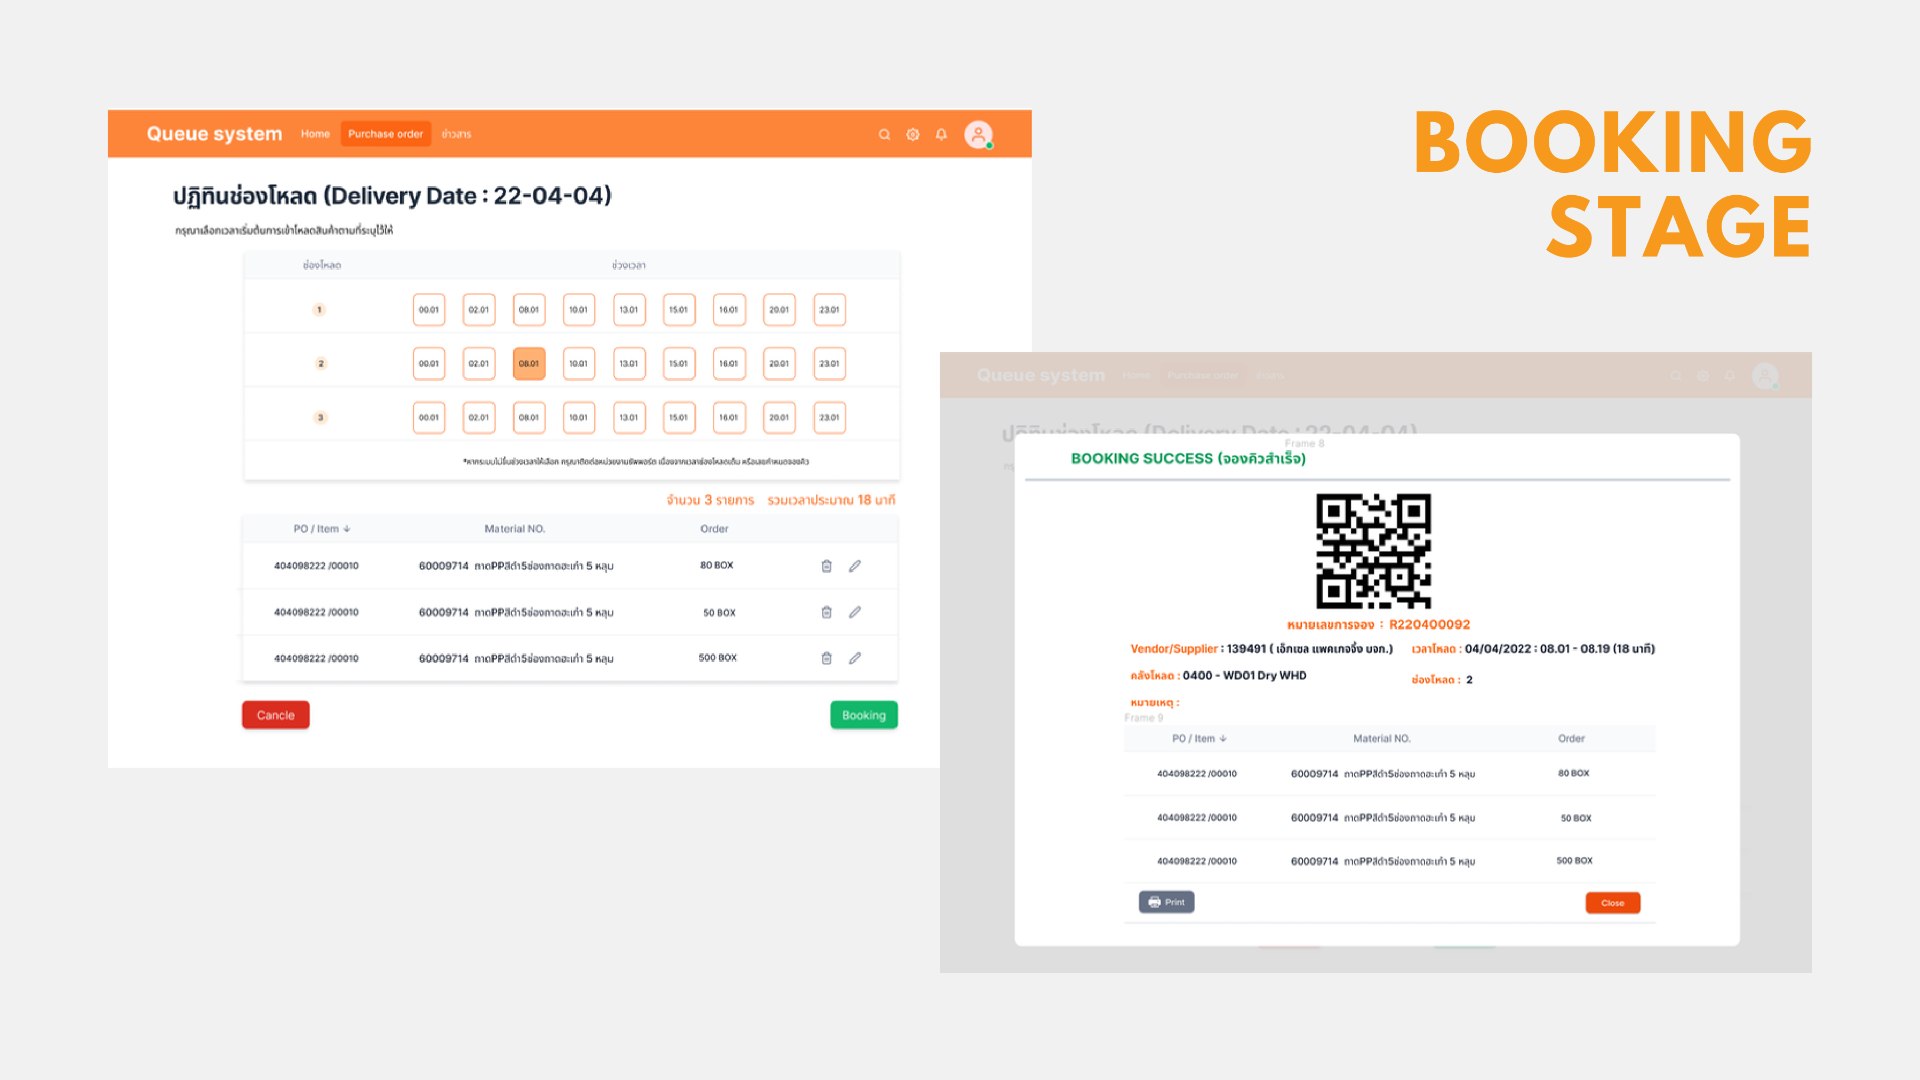
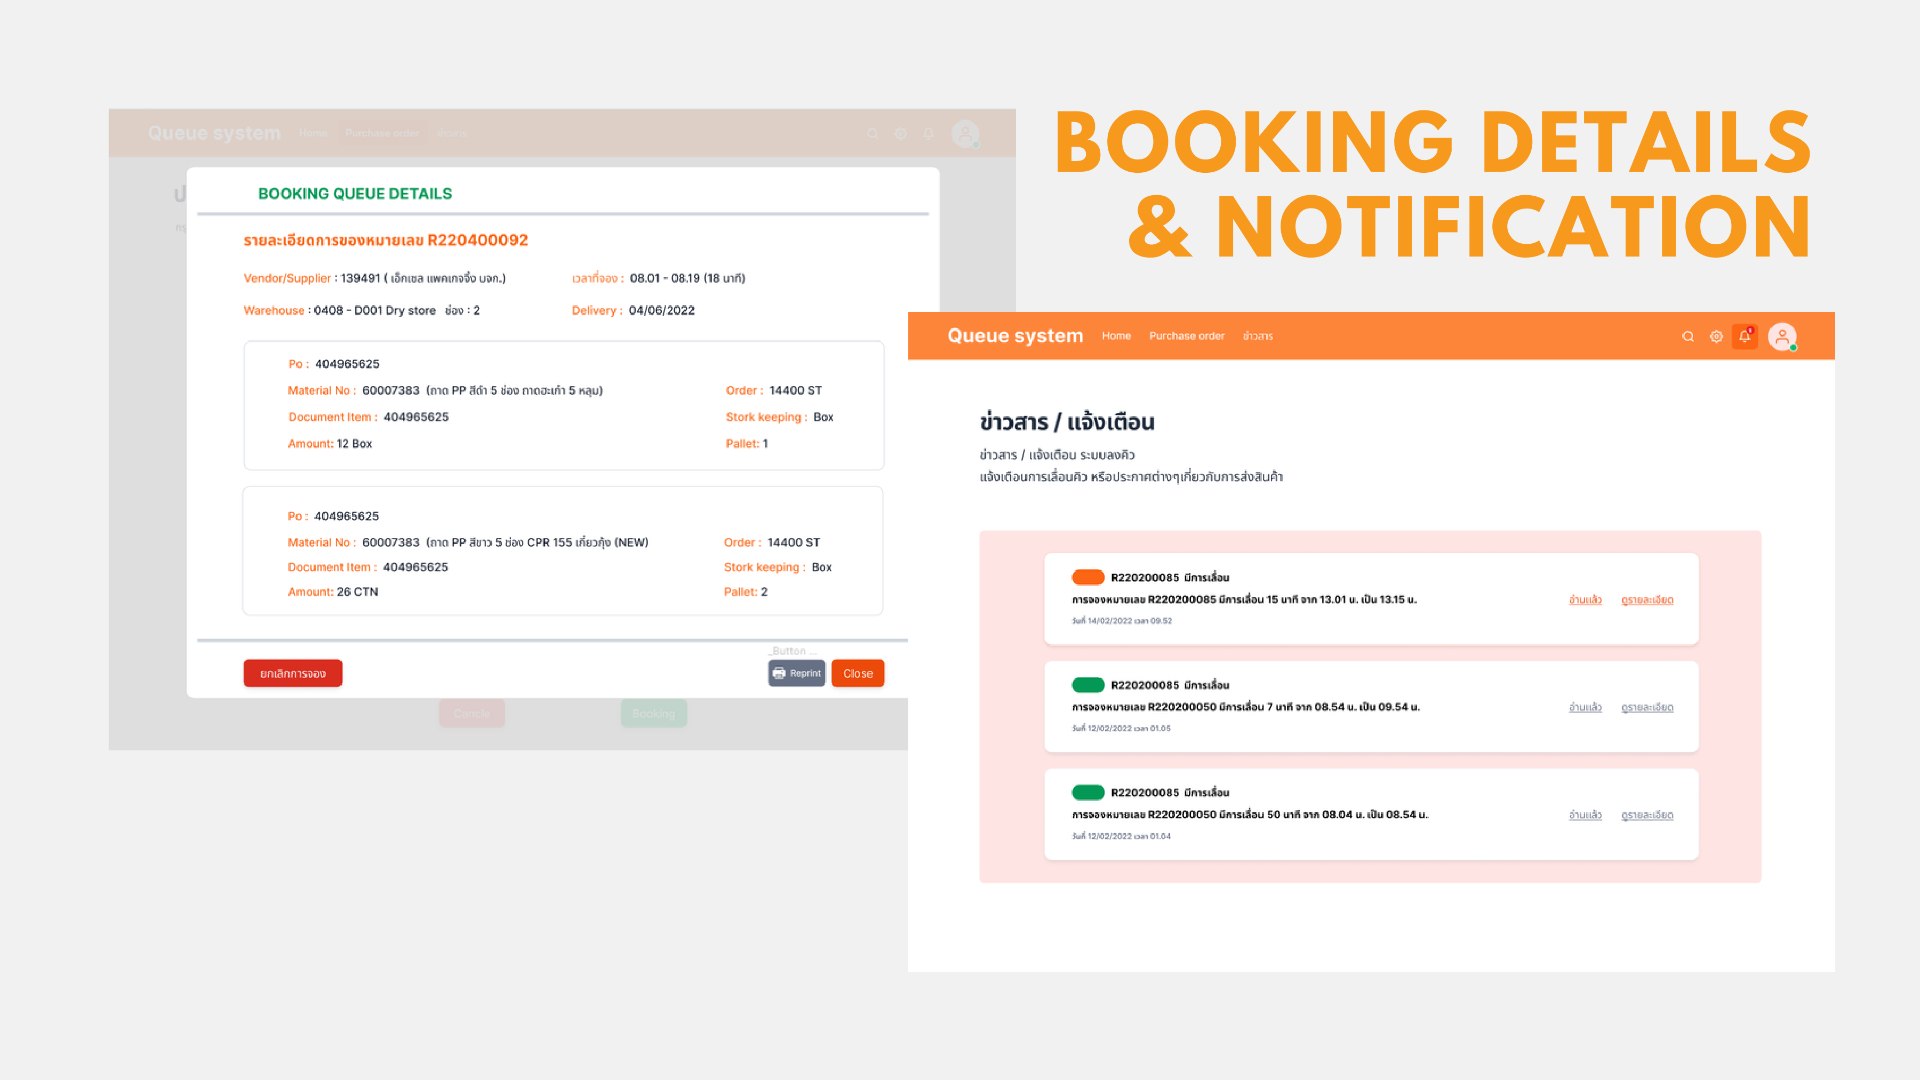
The flow was the real design work. A supplier logs in, sees the deliveries they owe, selects the POs going on one truck, opens the loading-dock calendar, takes a slot that still has capacity, and walks away with a QR code they can print and hand to the driver. Everything after that is confirmation and notification.
I sketched the low-fidelity screens by hand, because the people reviewing them were warehouse and IT staff rather than designers — pencil invites correction in a way a polished screen doesn't. Once the layouts held up, I built a small set of components (colour, type, inputs, buttons, grid) so the hi-fi prototype would be consistent and the IT team would have something specifiable to build from.
The prototype covered five screens: a dashboard with delivery status at a glance, a PO list with per-item detail, the loading-dock calendar, the booking confirmation with its QR code, and the notification a supplier gets when their queue moves.
Usability testing
Five tasks: login, dashboard, PO page, booking, report.
Testing the prototype on five tasks caught the kind of thing you only find by watching someone try. The biggest was an ordering problem in my own head: I had put the booking action where I thought about it, not where users arrive at it.
{{ findingRows }}The slot-conflict rule mattered more than it looks. Two suppliers can want the same dock at the same minute, and in an operational system the honest answer is that one of them loses — so the design's job is to make losing quick and clear, not to hide it.
Handoff & outcome
Supplier waiting time fell 67% — the target was 50%.
I handed the validated flows, components and prototype to CPRAM's internal IT team, who developed and deployed the system. The pilot ran May–July 2022, and on-time unloading climbed month over month from 60.5% to 72.7% — 67.7% across the pilot overall.
The system went live at the Lat Krabang plant and then rolled out to every regional plant — Lamphun, Khon Kaen, Chonburi, Surat Thani and Lat Lum Kaeo — with Smart Visual Stock, a lean-warehouse extension, on the roadmap after it. The project won the Ant Mission Award at CPRAM Event 2022.
Takeaways
What I'd carry into the next project.
Pricing a problem is how a researcher gets a seat at the table.
Nobody in that room argued with 273,750 THB of overtime. Converting frustration into the factory's own numbers turned a UX observation into an operations decision.
In B2B operations, the user with the worst experience has the least power.
Drivers absorbed six hours of the process and were the only group nobody had asked. Designing for them — not just for the warehouse — is what made the numbers move.
A clean handoff is a design deliverable, not an email.
The IT team built this without me. What made that possible was components with defined states, a documented flow, and every design decision traceable to a test finding they could question.